Monitor active queries
You can monitor active queries for your Neon project from the Monitoring page in the Neon Console. 1. In the Neon Console, select a project. 2. Go to Monitoring. 3. Select the Active queries tab. The ...
You can monitor active queries for your Neon project from the Monitoring page in the Neon Console.
- In the Neon Console, select a project.
- Go to Monitoring.
- Select the Active queries tab.
The Active queries view displays up to 100 currently running queries for the selected Branch, Compute, and Database. Use the Refresh button to update the list with the latest active queries.
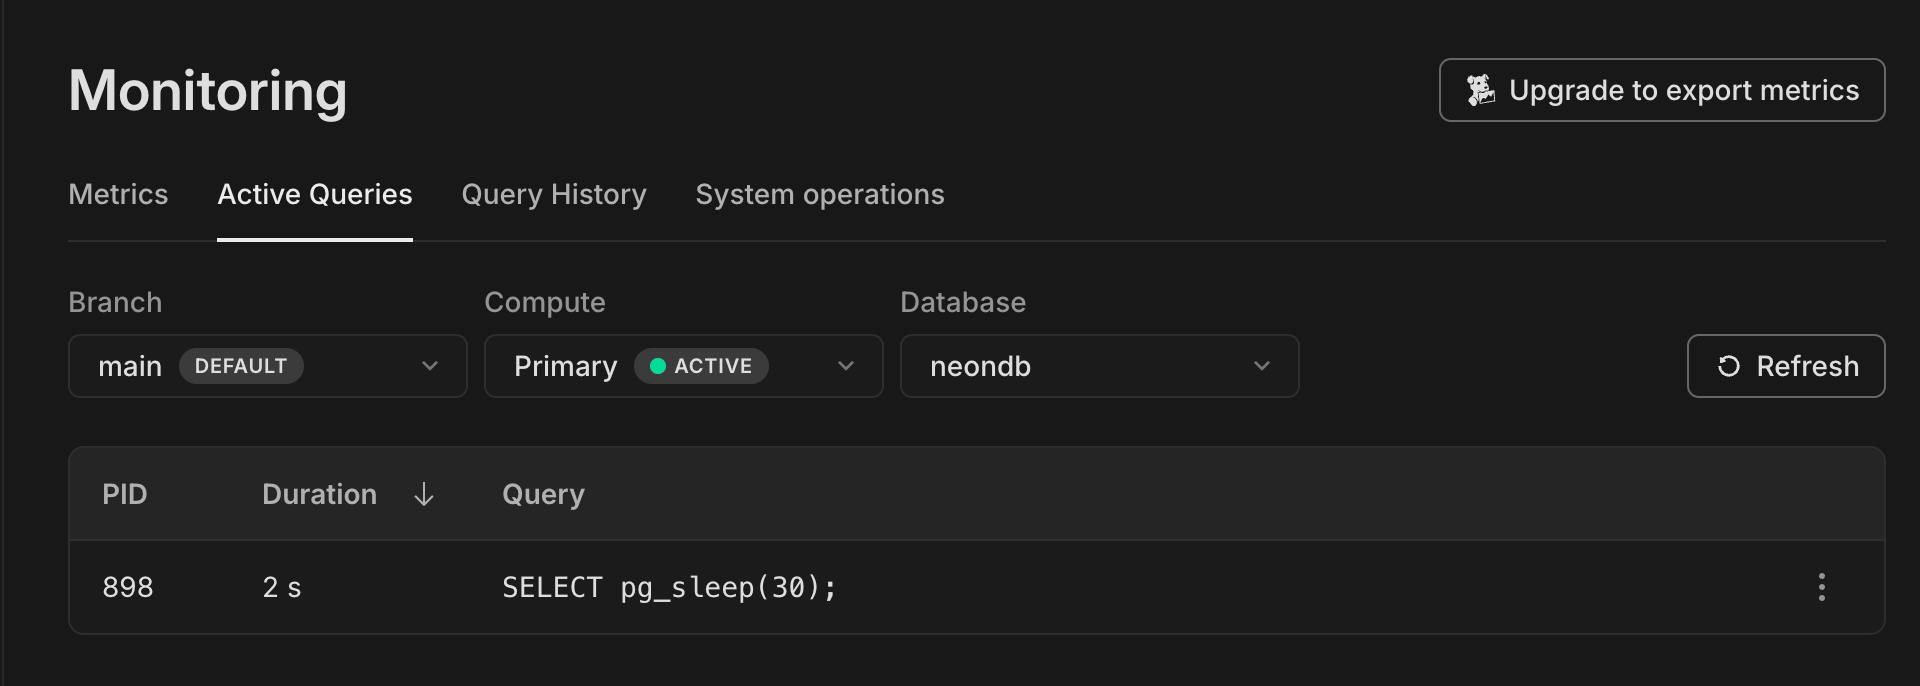
The Active queries view is powered by the pg_stat_activity Postgres system view, which is available in Neon by default. To run custom queries against the data collected by pg_stat_activity, you can use the Neon SQL Editor or any SQL client, such as psql.
For details on pg_stat_activity, see pg_stat_activity in the PostgreSQL documentation.